

Cracking the Code of Sequence Alignments: A Deep Dive into Log Expectation and Fast Fourier Transform
Have you ever heard your friend jokingly say that you come from Monkeys? It might sound like a funny friendly routine but imagine having a beef with one of your friends at some stage and he is also a bioinformatician and comes up with intricate relationships between you and some chimpanzees or mice because it is possible to decode complex connections between different species only using their genetic sequences. The evolutionary pathways can be traced among humans, chimps, and mice that may connect us all at some point. But this specific task is not as simple as it seems. The real question here is “How do the researchers confirm that the alignments they produce are both accurate, useful, and reproducible?”. The answer is given by advanced computational methods such as Fast Fourier Transform (FFT) and Log Expectation. These techniques are essential for maximizing and decoding multiple sequence alignments (MSA), which improves our knowledge of evolutionary interactions.
What is Multiple Sequence Alignment (MSA):
Multiple Sequence Alignment is a computational technique that is used to identify similar regions in biological sequences like DNA, RNA, or protein, these similar regions as a result tend to provide important details about the structural, functional, or evolutionary links between the sequences. The aim of MSA is to align the sequences at similar places throughout the sequences, which gives information about conserved regions that are functionally or structurally important.
Example:
Consider the following sequences from two different species:
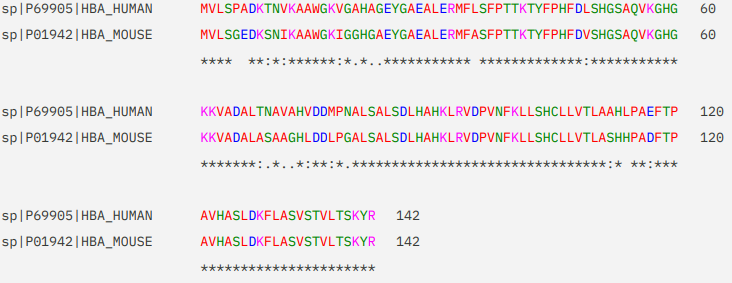
Human:MVLSPADKTNVKAAWGKVGAHAGEYGAEALERMFLSFPTTKTYFPHFDLSHGSAQVKG HG
Mouse:MVLSGEDKSNIKAAWGKIGGHGAEYGAEALERMFASFPTTKTYFPHFDVSHGSAQVKGH G
Using ClustalW alignment will be shown as:
Log Expectation in Multiple Sequence Alignment
What is Log Expectation?
Log expectation (LE) is a statistical parameter applied to multiple sequence alignments to analyze the quality of an alignment. The possibility that the observed alignment happened by accident may be assessed using the LE score. A higher LE score shows a more important alignment, which suggests that the sequences have a biological link of biological significance.
How to calculate Log Expectation?
The LE score is computed by dividing the likelihood of the observed sequence alignment by the probability of the alignment occurring by chance, and this is done using the log-odds ratio. For the log-odds score (S), the formula is
S=log (P(random alignment) \ P(observed alignment))
Where,
P (observed alignment) is the probability of the observed alignment.
P (random alignment) is the probability of the alignment occurring by chance.
An alignment that is biologically important has a higher log-odds score, which indicates that it is less likely to have happened by accident.
Example:
Sequence 1: ATGCGT
Sequence 2: ATG-CT
Sequence 3: ATGCGC
Based on the observed matches and mismatches as well as the possibility that these occurrences happened by chance, the LE score for this alignment is determined. We can say that if the LE score is noticeably high, the sequences have a common ancestor or role.
Fast Fourier Transform in Multiple Sequence Alignment
What is the Fast Fourier Transform?
The Fast Fourier Transform (FFT) is a statical parameter that transforms a sequence of data points from the time domain into the frequency domain. Let us understand it as:
Time Domain:
This is how most data, such as a heart rate or sound wave, are shown throughout time. It illustrates how things evolve throughout time.
Consider a song as an example. You can hear the song playing second by second in the time domain.
Frequency Domain:
An alternative method of examining the same data is the frequency domain method, which displays the various frequencies (or pitches) that comprise the sound rather than the way it varies over time. As an illustration, suppose you took the song and separated each note's loudness. The frequency domain is seen here.
Same as this, the FFT takes the data from time domain (how it changes over time) and transforms it into the frequency domain (what frequencies are present and how strong they are). For example, RR intervals are used to measure heart rate data over time. This data is transformed into the frequency domain using FFT, yielding frequencies that correspond to various aspects of heart rate variability. Certain frequencies or rhythms may be seen in the frequency domain; strong parasympathetic nervous system activity is indicated by high power at low frequency, while strong sympathetic nervous system activity is indicated by high power at high frequency.
One application of FFT in bioinformatics is the detection of periodicity in DNA sequences. For instance, certain proteins bind to DNA at regularly spaced intervals, and FFT can help identify these periodic binding sites.
Example:
Suppose we have the following DNA sequences:
Sequence 1: ATCGATCGATCGATCGATCG
Sequence 2: ATCGATCGTTTATCGATCG
Sequence 3: ATCGATCGATCGGGGATCG
These sequences have a repeating pattern ATCGATCG every 10 bases. Convert each DNA sequence into numerical values (e.g., A=1, T=2, C=3, G=4) and apply FFT to detect the periodicity. From the FFT results, we can identify a peak at the frequency corresponding to the periodicity of 10 bases. Let's assume we detect a strong peak at frequency 0.1, which corresponds to a periodicity of 10 bases. Now, we can use the identified periodic pattern to guide our multiple sequence alignment. Tools like Clustal Omega or MUSCLE can align sequences more effectively by taking into account the periodicity identified through FFT.
Final thoughts:
Strong techniques for examining biological sequences can be obtained by combining the Fast Fourier Transform with Log Expectation. While FFT finds recurring patterns and motifs to improve the precision and effectiveness of MSA, LE assists in scoring alignments based on predictive models. The advantages of both approaches are combined in an integrated approach, which provides a strong toolkit for bioinformatics research and analysis.
References
Sievers F, Higgins DG. Clustal Omega, accurate alignment of very large numbers of sequences. Methods Mol Biol. 2014;1079:105-16. Doi 10.1007/978-1-62703-646-7_6. PMID: 24170397.
Cooley, J. W., & Tukey, J. W. (1965). An algorithm for the machine calculation of complex Fourier series. Mathematics of Computation, 19(90), 297-301.
Yao, Z., & Jaromczyk, J. W. (2009). An FFT-based method for multiple sequence alignment. IEEE/ACM Transactions on Computational Biology and Bioinformatics, 6(2), 288-298.
Tools & resources:
ClustalW The EMBL-EBI Job Dispatcher sequence analysis tools framework in 2024. http://europepmc.org/abstract/MED/38597606
FFT in R Documentation
msa Package Documentation Bodenhofer U, Bonatesta E, Horejs-Kainrath C, Hochreiter S (2015). “msa: an R package for multiple sequence alignment.” Bioinformatics, 31(24), 3997– 3999. doi:10.1093/bioinformatics/btv494.
Further Reading:
Lesk, A. M. (2019). Introduction to Bioinformatics. Oxford University Press.
Mount, D. W. (2004). Bioinformatics: Sequence and Genome Analysis. Cold Spring Harbor Laboratory Press.
Gusfield, D. (1997). Algorithms on Strings, Trees, and Sequences: Computer Science and Computational Biology. Cambridge University Press.
Connect with me @www.linkedin.com/in/laiba-adeel-509845236
