

What are DNA Microarrays?
DNA microarrays consist of an organized grid pattern of DNA arranged on solid supports, usually made of silicon or glass. Each DNA spot, known as a probe, corresponds to a single gene, allowing for the simultaneous analysis of tens of thousands of genes' expression. Microarray analysis is incredibly useful for assessing gene expression, detecting SNPs, and identifying specific DNA sequences. Gene expression is a crucial factor in the body, as it varies from cell to cell. While all cells have the same number of genes, their expression levels differ. For diseases such as arthritis, cancer, and more, the expression levels of various genes would differ between individuals with the disease and those without.
What is Gene Expression?
The process of gene expression involves the production of mRNA at a specific moment in time, and the quantity of mRNA within a cell directly correlates to the level of gene activity. By measuring the amount of synthesized mRNA, we can accurately determine the extent to which a specific gene is being expressed.
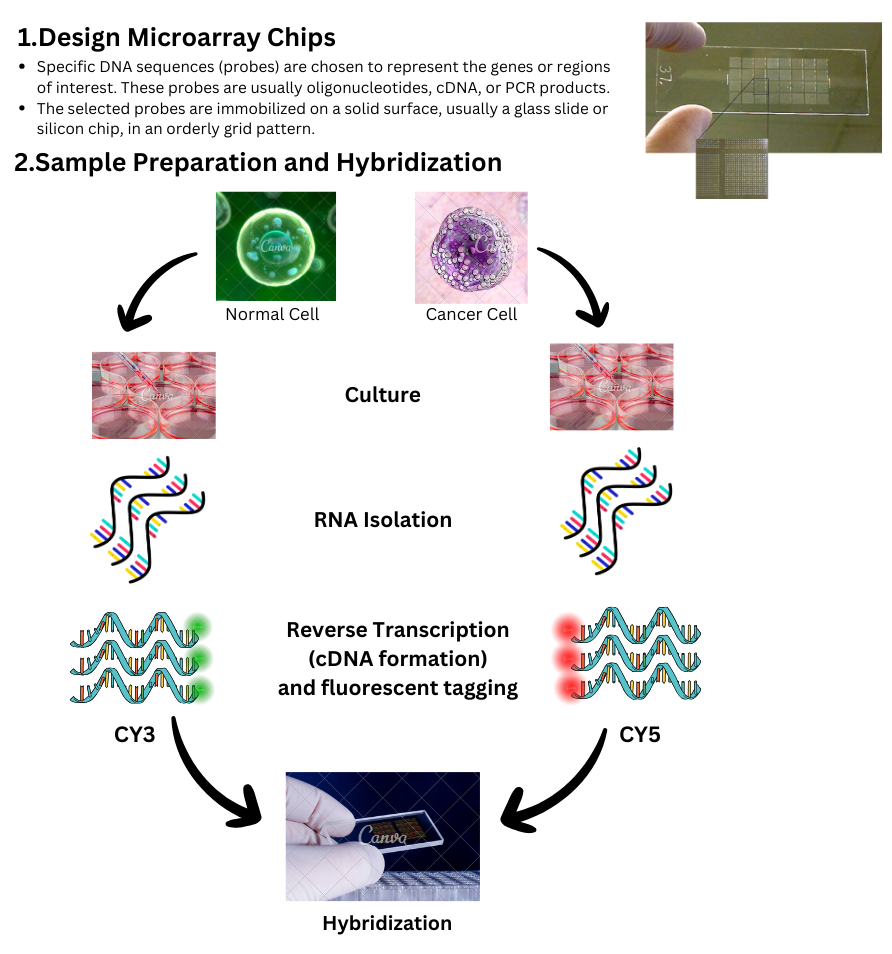
How does a microarray system work?
DNA microarray technology is based on the hybridization of nucleic acid strands.
Bioinformatics Data Analysis:
GEO (Gene Expression Omnibus):
The Gene Expression Omnibus (GEO) database is maintained by the National Center for Biotechnology Information (NCBI), which is a division of the National Library of Medicine (NLM). In addition to comprehensive descriptions of sample characteristics, experimental design, and protocols for high-throughput gene expression and genomics research, this database includes a multitude of raw and normalized data.
The NCBI developed the GEO database in 2000, and it holds a wealth of high-throughput gene expression data. Major journals began requiring the deposit of microarray data in public repositories around 2002. This prerequisite drove GEO's rapid growth and success. With the development of high-throughput genomic research over time, GEO evolved to incorporate new technologies like RNA-Seq and ChIP-Seq. Many data formats, such as high-throughput nucleic acid sequencing, DNA microarrays, protein and tissue arrays, SAGE, RT-PCR, and more, can now be handled by this database (Clough & Barrett, 2016).
How can we leverage this database for our research?
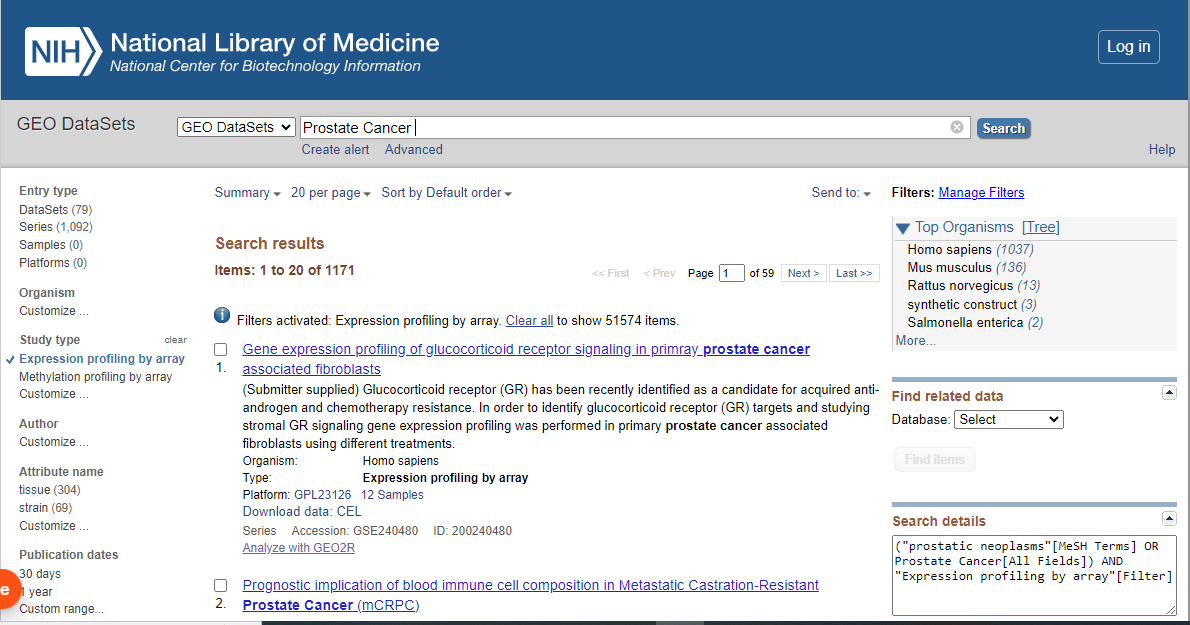
Go to NCBI.
Enter your search query, for example: "Prostate Cancer".
From The drop-down menu select GEO Datasets and press search.
From side bar select “Expression Profiling by Array”.
From side bar select “ Datasets”.
After obtaining your desired result, you will find two accession numbers. The first one will be the Series Accession number and the other one will be the Dataset Accession number.
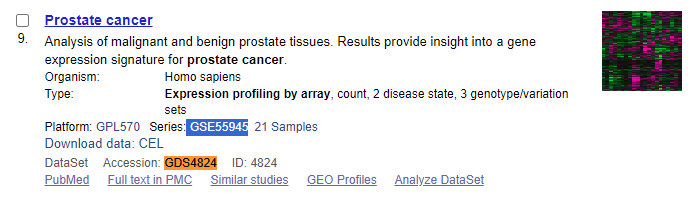
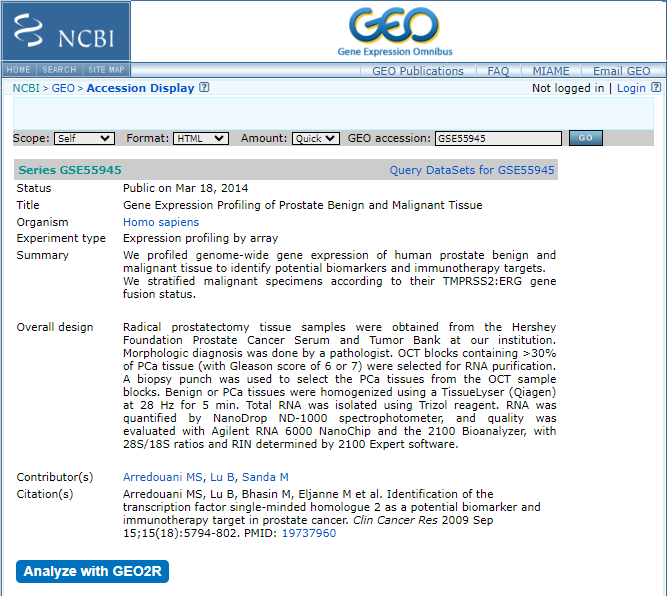
Click on the Series Accession Number, which is GSE55945 in our case.
A new tab labeled "GEO Accession Viewer" will open up with the GEO (Gene Expression Omnibus) interface. Here you will find all the necessary information regarding your entry.
Click on “Analyze with GEO2R”.
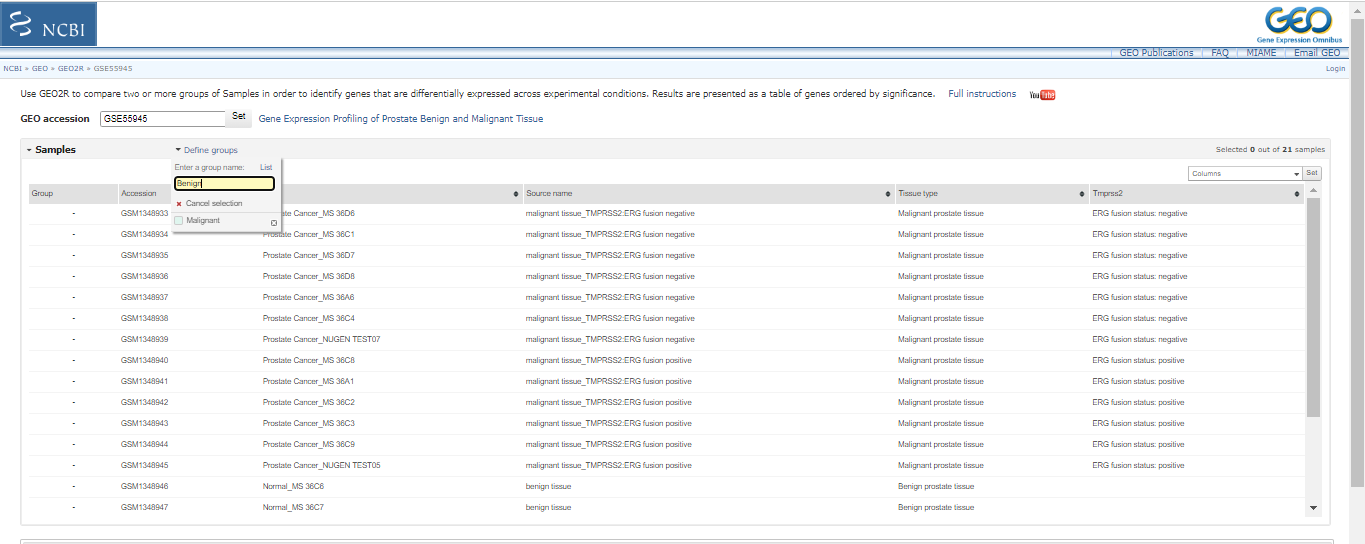
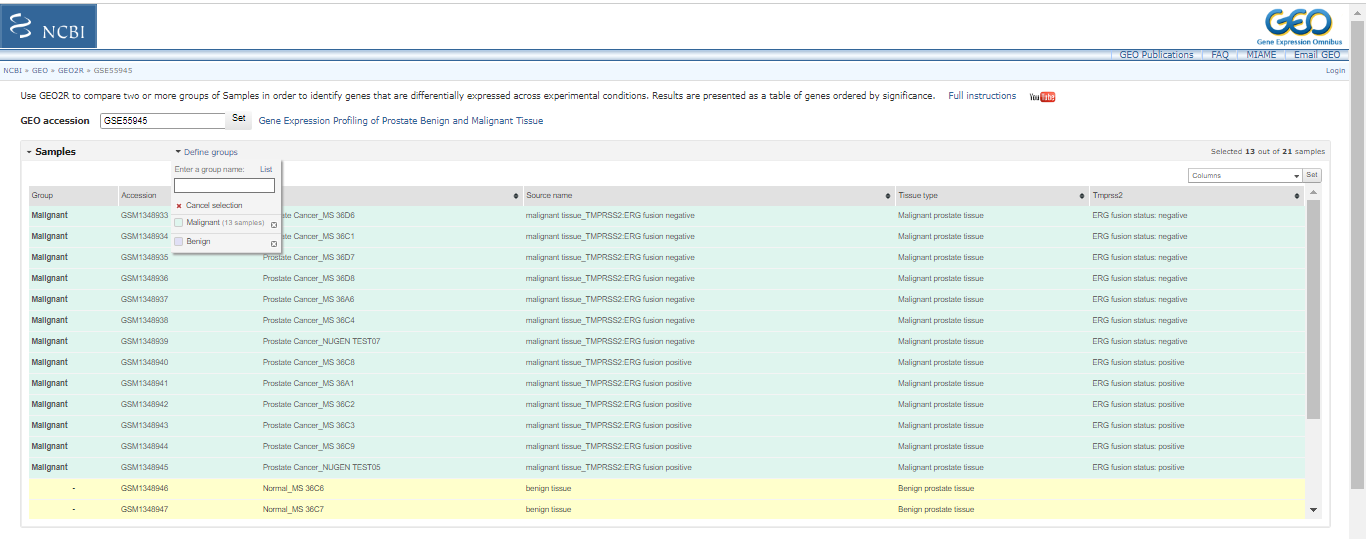
First, create two groups called "Malignant" and "Benign" by clicking on "Define Groups". Then, sort the resulting samples into their respective groups by typing the group name and pressing enter. You can select samples from the table by dragging and assigning them to the appropriate group by clicking on the group name in the "Define Groups" section.
Click on “options”
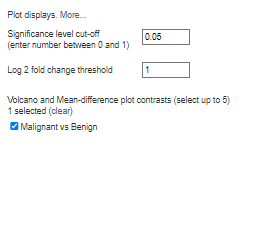
Since most students might not be familiar with the functions of the algorithms, leave all other choices at their default values. You may easily adjust the Log 2-fold change threshold and cut-off value as desired. Any result with a p-value less than or equal to 0.05 would be regarded as statistically significant if your analysis has a significance level cut-off of 0.05. There will be no difference in gene expression between the experimental and control groups when the log2 fold change is 0. By setting the threshold to zero, you are effectively removing the fold change filter, which means that all genes will be taken into account regardless of how small their expression change is. With a log2 threshold of 1, more genes will meet the criteria for differential expression. So, you will select genes with a log2 fold change of ≥ 1 and ≤ -1. This can increase the number of differentially expressed genes (DEGs) detected in your analysis. Increasing Log2 will make your data more inclusive and less noisy.
Then click on “Reanalyze”.
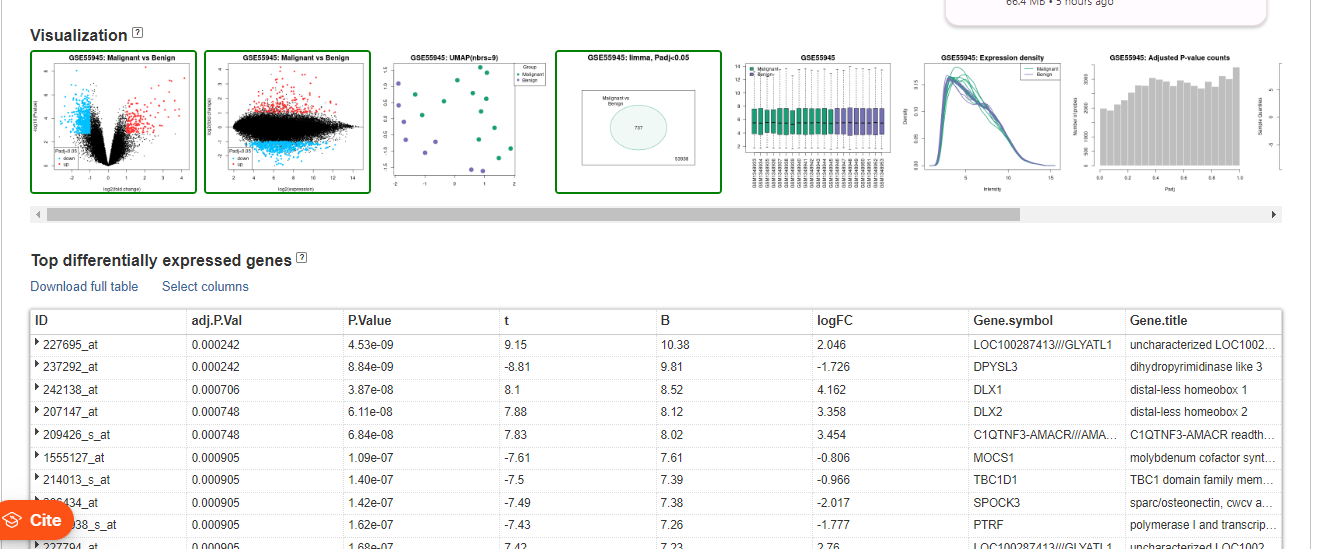
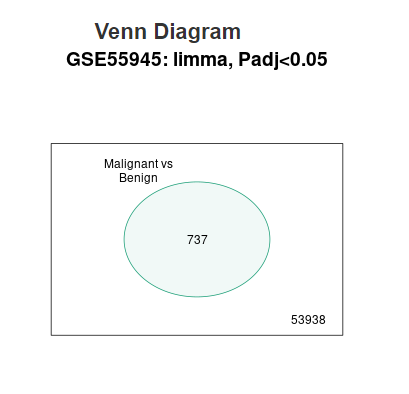
A subset of 737 genes, depicted in the Venn diagram, exhibit a substantial variation in expression and may be crucial in distinguishing between benign and malignant samples.The genes outside the circle, numbering 53938, either maintain constant expression or undergo changes that are not significant enough to be relevant for this comparison.
Now click on “download full table”
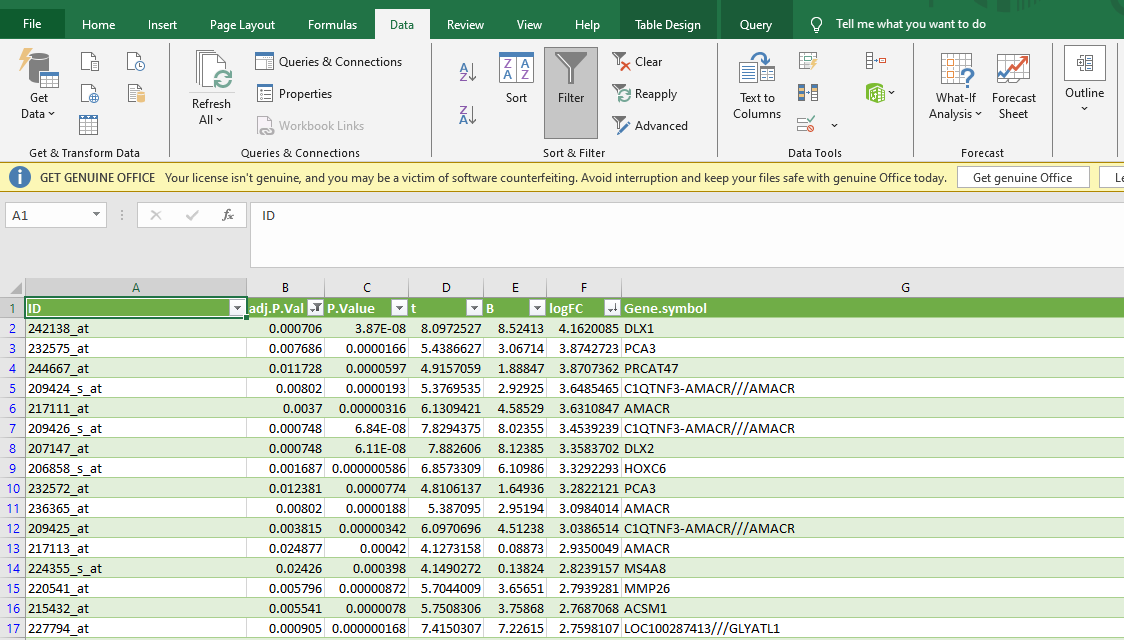
Open this table data in an MS Excel file. For this purpose, select the following in Excel: “data” tab in the top horizontal menu bar >“From text” >A dialogue box will pop up> Go to downloaded table location > In file type option select “All Files” >Click on “Import” >load. The recently downloaded Table will be transferred.
A filter will be applied to the "adjusted P value" column to display genes with a P value of less than or equal to 0.05, reducing the enormous quantity of data to only those genes that significantly impact patients. For this, select "number filter" -> "less than or equal to" and then input "0.05" by clicking the downward arrow next to the adjusted P value column.
For easy analysis, simply click on the dropdown button in the Log FC cell and select "largest to smallest."
To obtain the names of all differentially expressed genes, simply click on the Venn diagram, then go to Explore and Download, and finally select Download Significant Genes. This will provide you with the names of the differentially expressed genes based on your analysis settings.
https://github.com/marskar/stats4genomics/blob/master/geo2r.R
This script is designed for analyzing DNA microarray data using R. It is specifically optimized for data available in the GEO database. Please note that it may require modifications to work with personal data.
Conclusion:
To uncover valuable genetic insights, mastery of extracting and analyzing DNA microarray gene expression data from GEO using Excel is essential. These skills are imperative for confidently handling and interpreting complex genetic data in your research.
References:
- Clough, E., & Barrett, T. (2016). The Gene Expression Omnibus Database. Methods in Molecular Biology, 93–110. https://doi.org/10.1007/978-1-4939-3578-9_5
